
I have been wondering why a nearly-idle service, using Pub/Sub for an async pipeline, has 5+ second end-to-end latency. Besides the usual ~1s of inter-service call time, Pub/Sub itself adds 3+ seconds.
Suspected our own app code, Pub/Sub’s Exactly-Once Delivery and cold start. To verify, I deployed a Go service locally and on GKE, and used Cloud Trace to investigate.
Pub/Sub Exactly-Once Delivery(EOS) adds significant, non-trivial latency. Latency-sensitive applications should use EOS with caution. Didn’t test at 100 RPS. Maybe Pub/Sub delivers on its promise under high throughput.
Feel free to share in the comments if you know more about this. I might be wrong.
Latency Factors
- https://docs.cloud.google.com/pubsub/docs/pull
- https://docs.cloud.google.com/pubsub/docs/pull-troubleshooting
Honestly, Pub/Sub’s docs don’t explain this latency at all.
GCP admits exactly-once delivery adds latency but no further explanation: https://docs.cloud.google.com/pubsub/docs/exactly-once-delivery
Exactly-once delivery subscriptions have significantly higher publish-to-subscribe latency compared to regular subscriptions.
Cold start. Probably the biggest one. Pub/Sub is fully managed. Nothing to tune server-side. We can only wish for more traffic, hoping it gets better.
NumGoroutines. Configure ReceiveSettings.NumGoroutines.
Easy to overlook, but must be set right. Otherwise a service waits on the old message’s modack before pulling a new one.
Docs say it doesn’t affect concurrent processing. True, but it affects pulling new messages!
Exactly-Once Delivery. Warm or cold, EOS is consistently hundreds of milliseconds higher per hop than standard. Not caused by network distance, as it was reproduced on GKE within same region.
That “hundreds of milliseconds” splits into two pieces.
-
Delivery gap Publish ended → subscribe span starts. No span observed. Pure GCP backend routing. Only inferable from timestamps.
-
EOS dispatch gap Subscribe span starts → Ready to handle the message. This is client code. Confirmed in cloud.google.com/go/pubsub/v2@v2.7.0/iterator.go. The client blocks before handing the message to the callback function.
if !exactlyOnceDelivery { // fire-and-forget, batched with a ticker } else { // If exactly once is enabled, we should wait until modack responses are successes // before attempting to process messages. ctx := context.Background() it.sendModAck(ctx, ackIDs, deadline, false, true) for ackID, ar := range ackIDs { _, err := ar.Get(ctx) // <-- blocks here } }ar.Get(ctx)= real backend round trip, server confirming the message’s lease before the callback runs. Standard delivery skips this. That’s why only EOS shows this extra delay.
The Traces
- Two real typical traces below, same environment, one per chain.
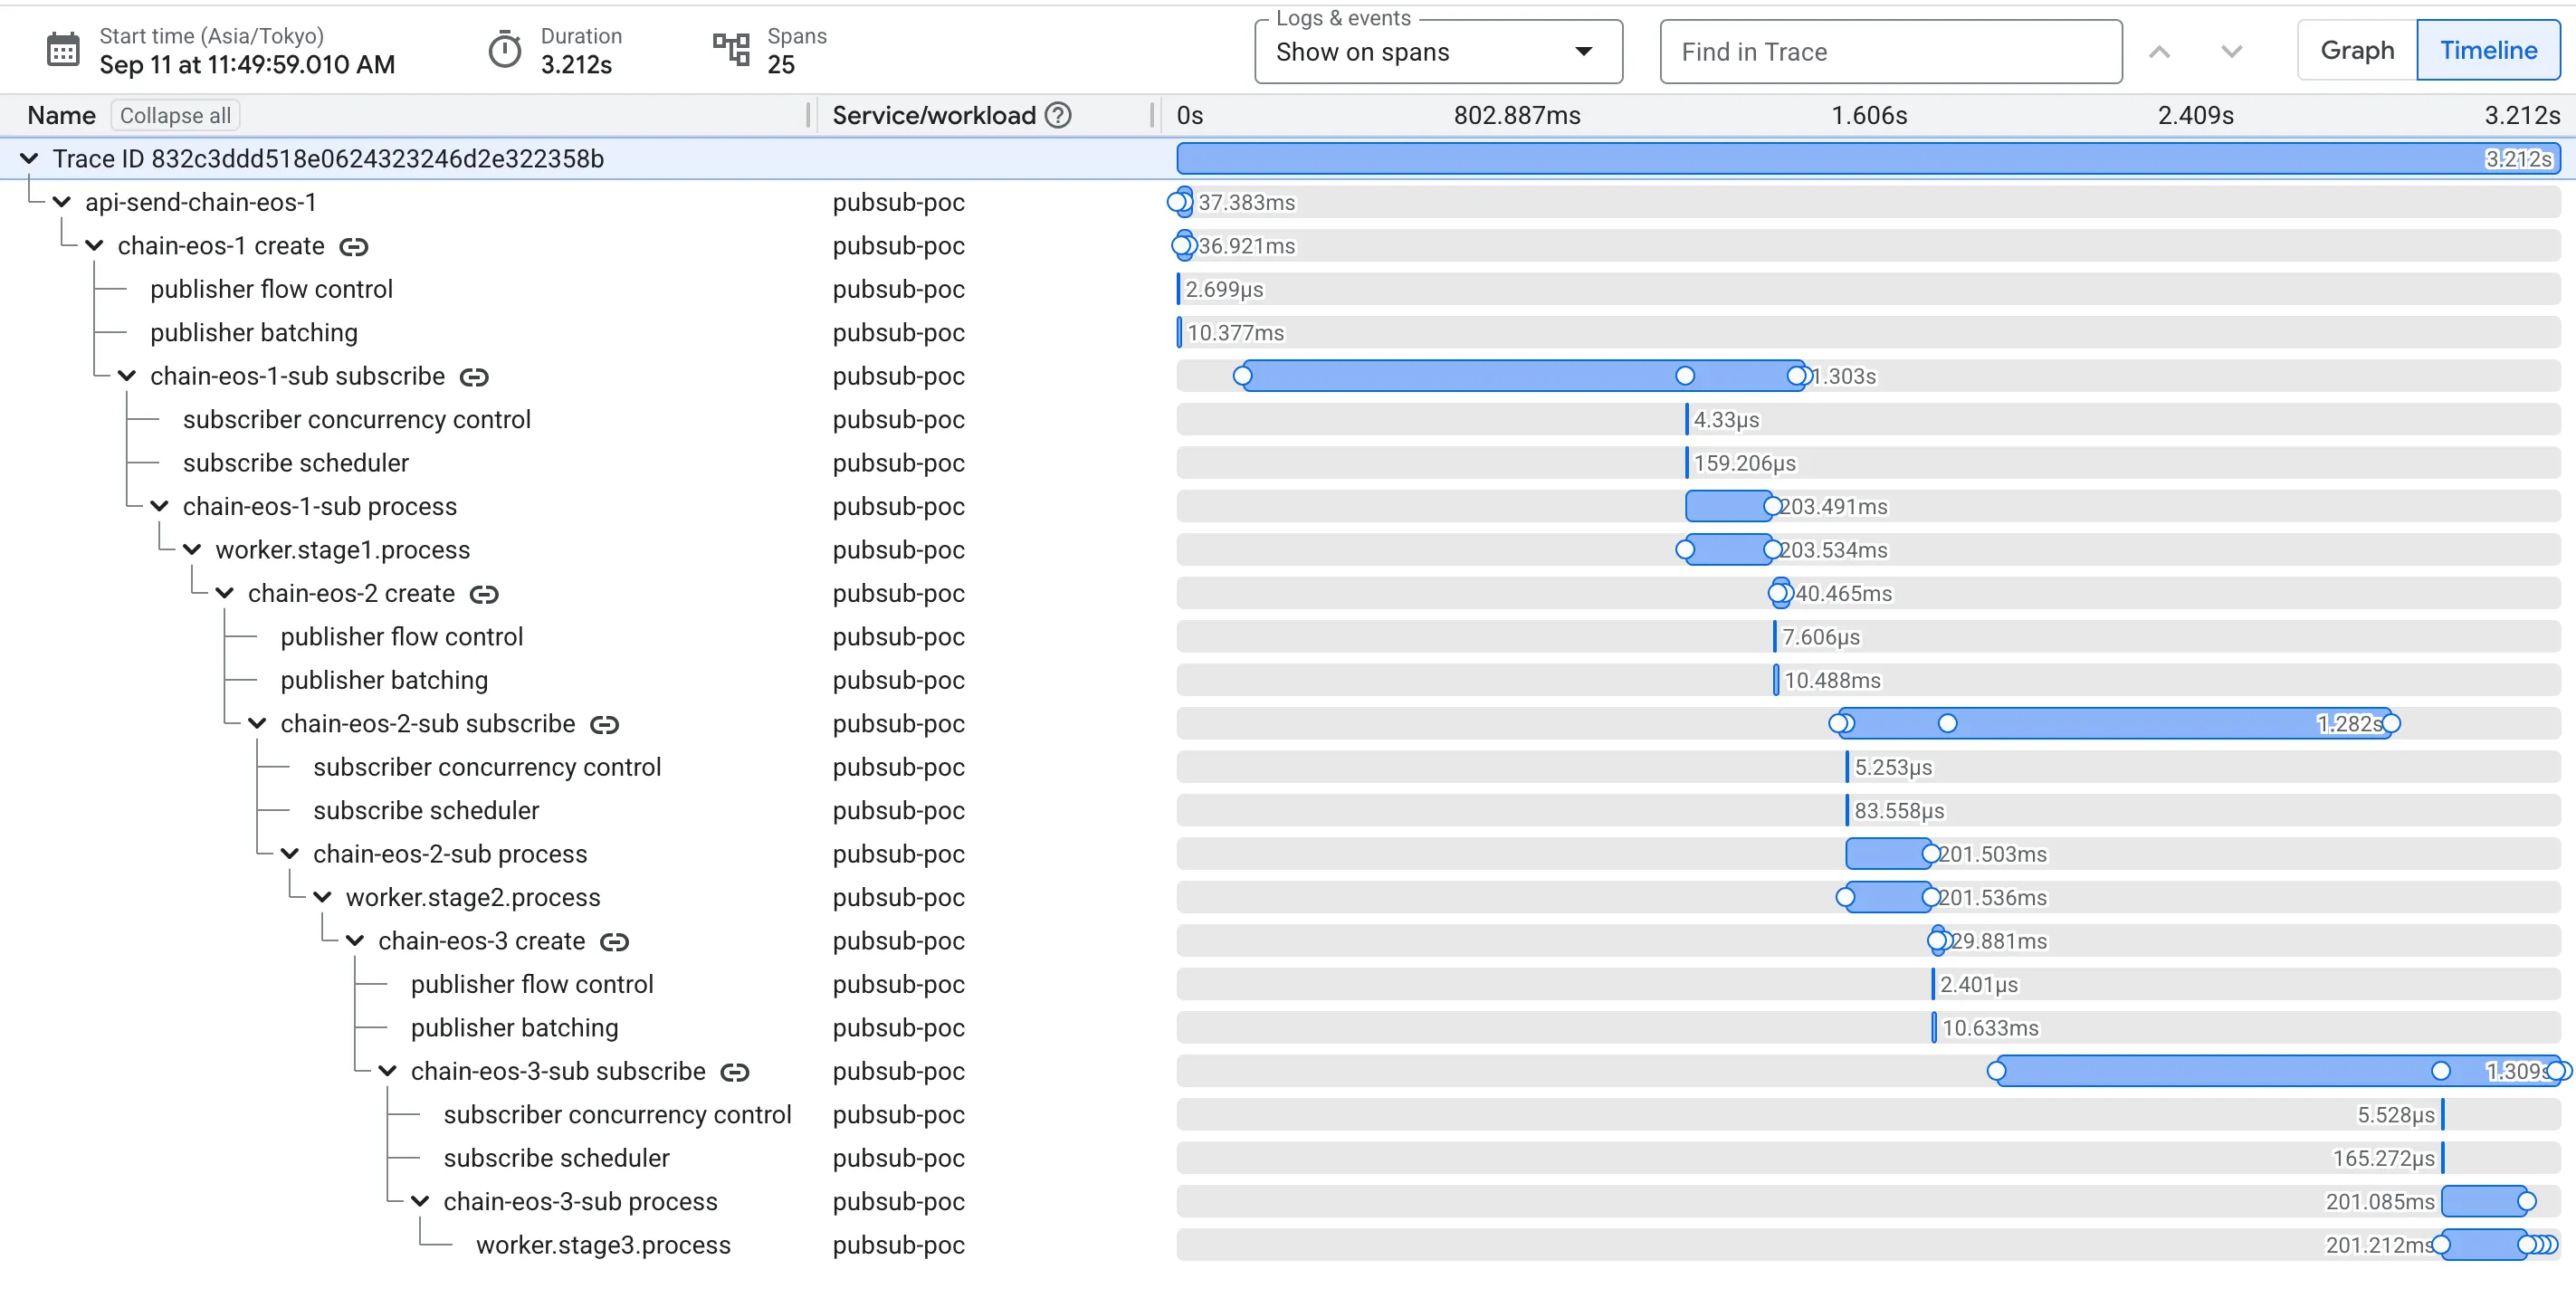
- Both on the warm side of their own distribution: EOS here 3.212s, std here 764.9ms.
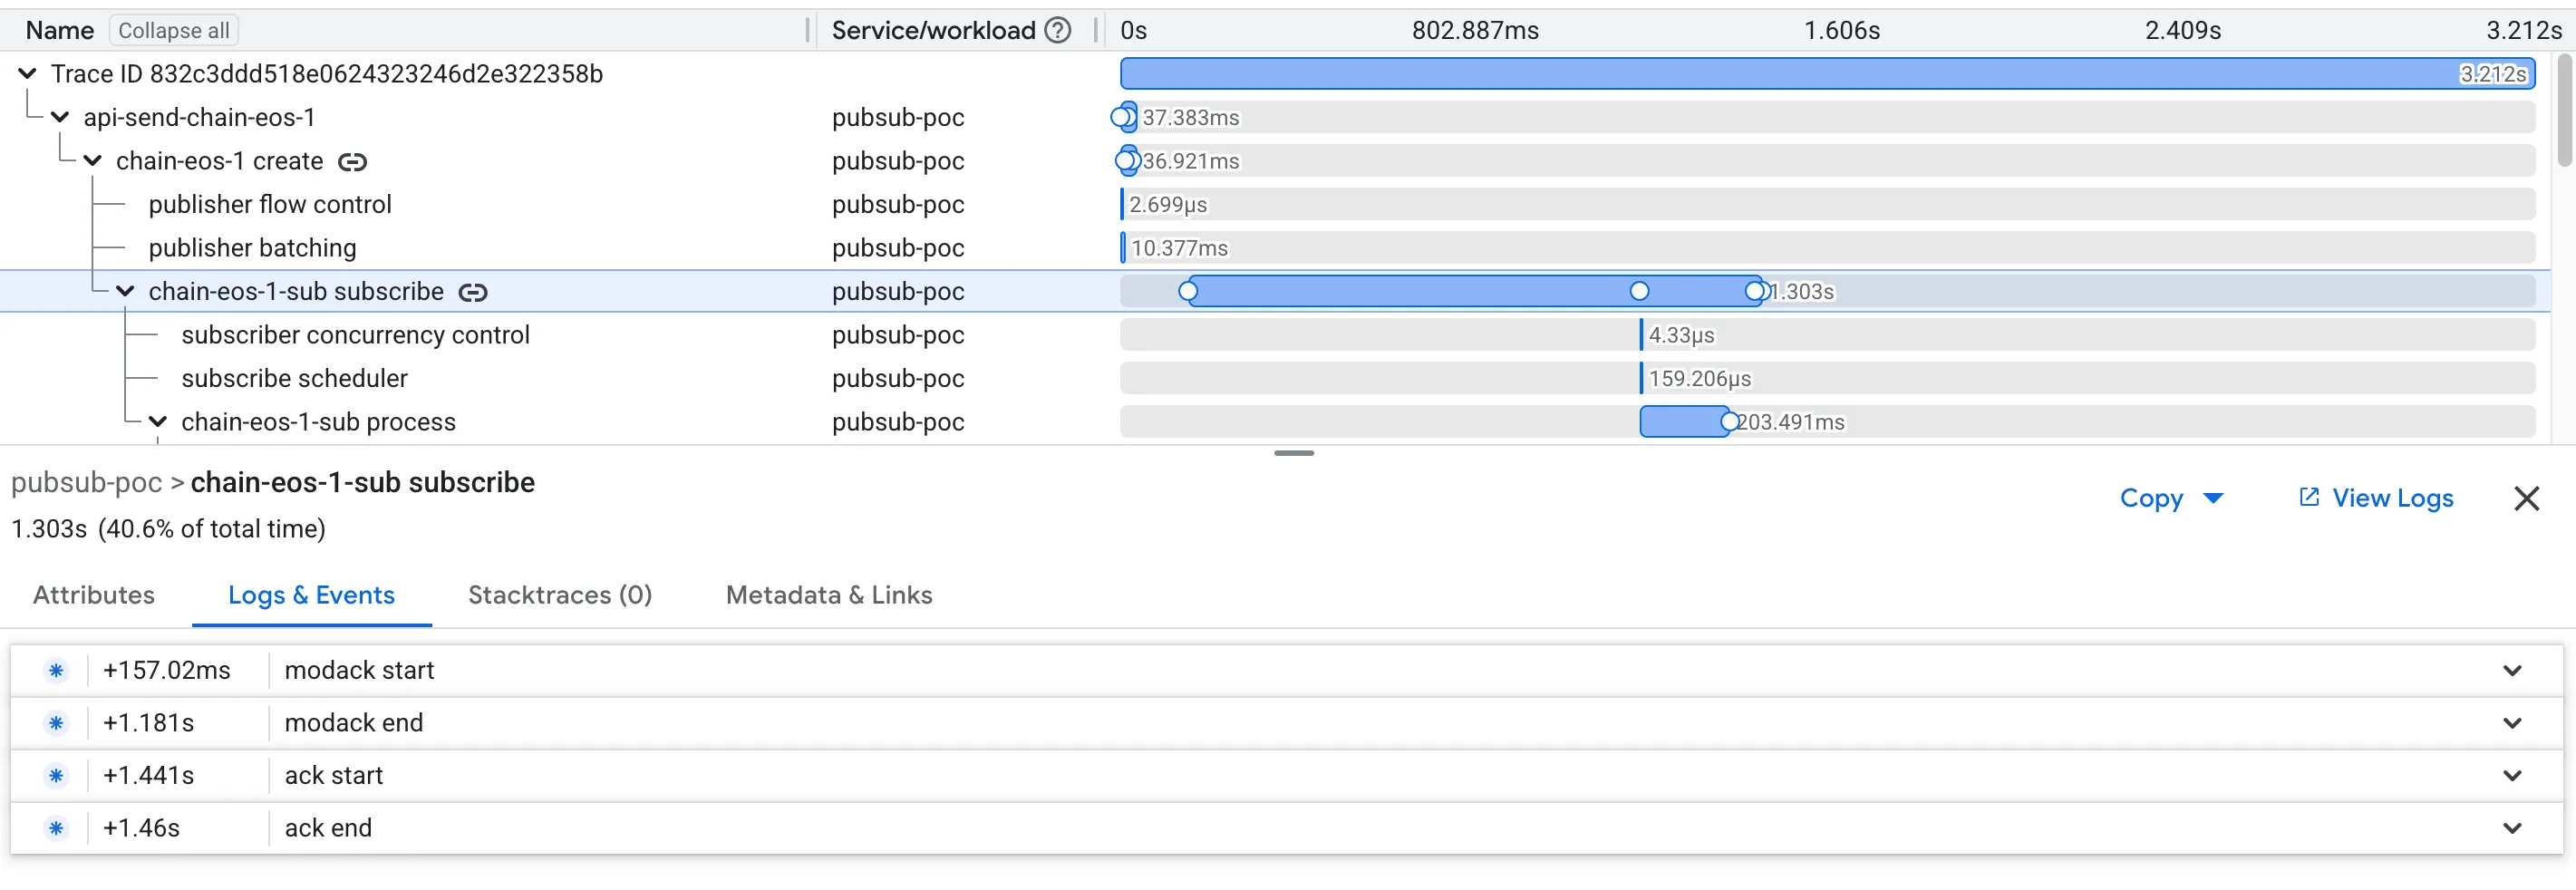
EOS chain, chain-eos-1-sub subscribe 1.303s
Warm 832c3ddd518e0624323246d2e322358b
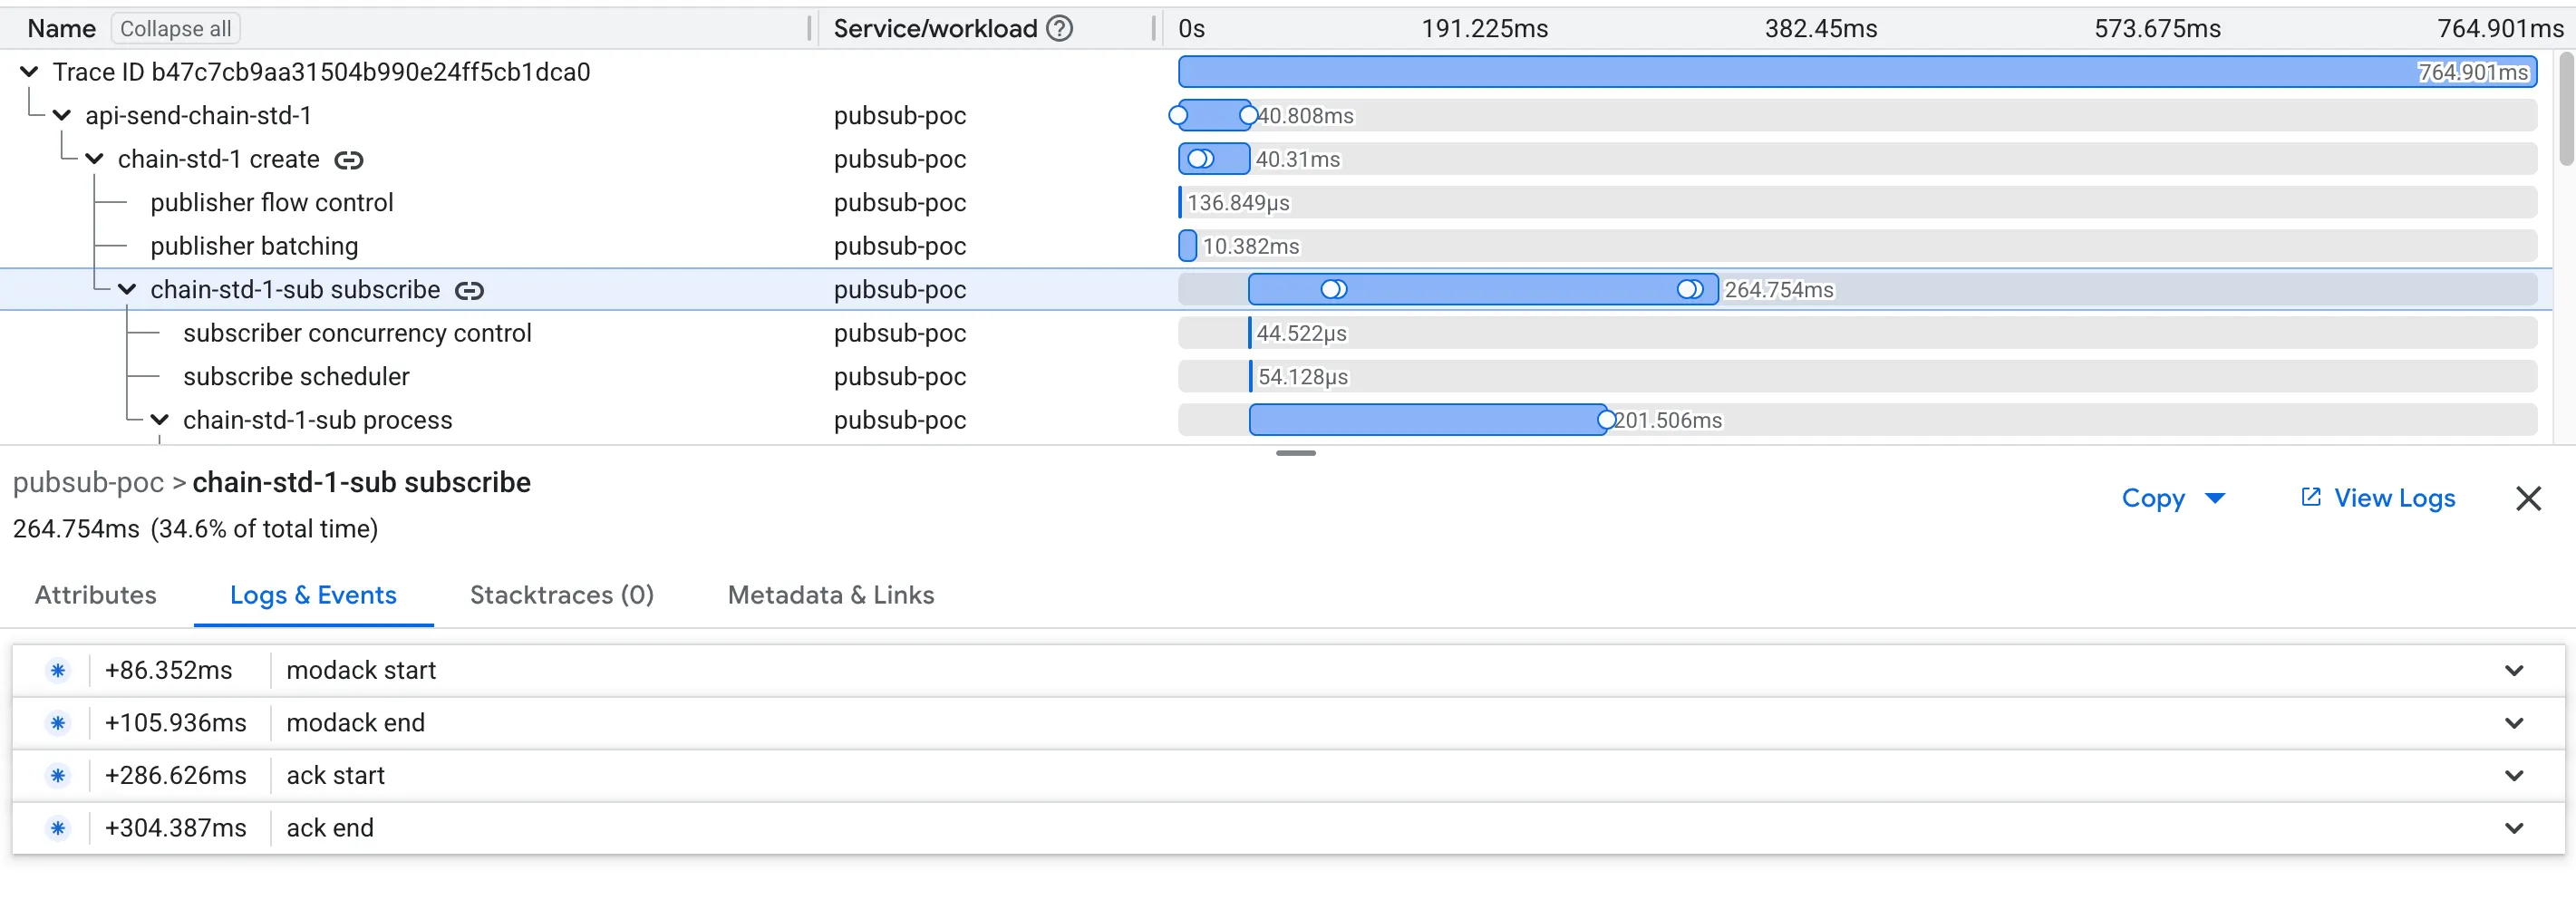
Standard chain, chain-std-1-sub subscribe span: 264ms
Warm b47c7cb9aa31504b990e24ff5cb1dca0
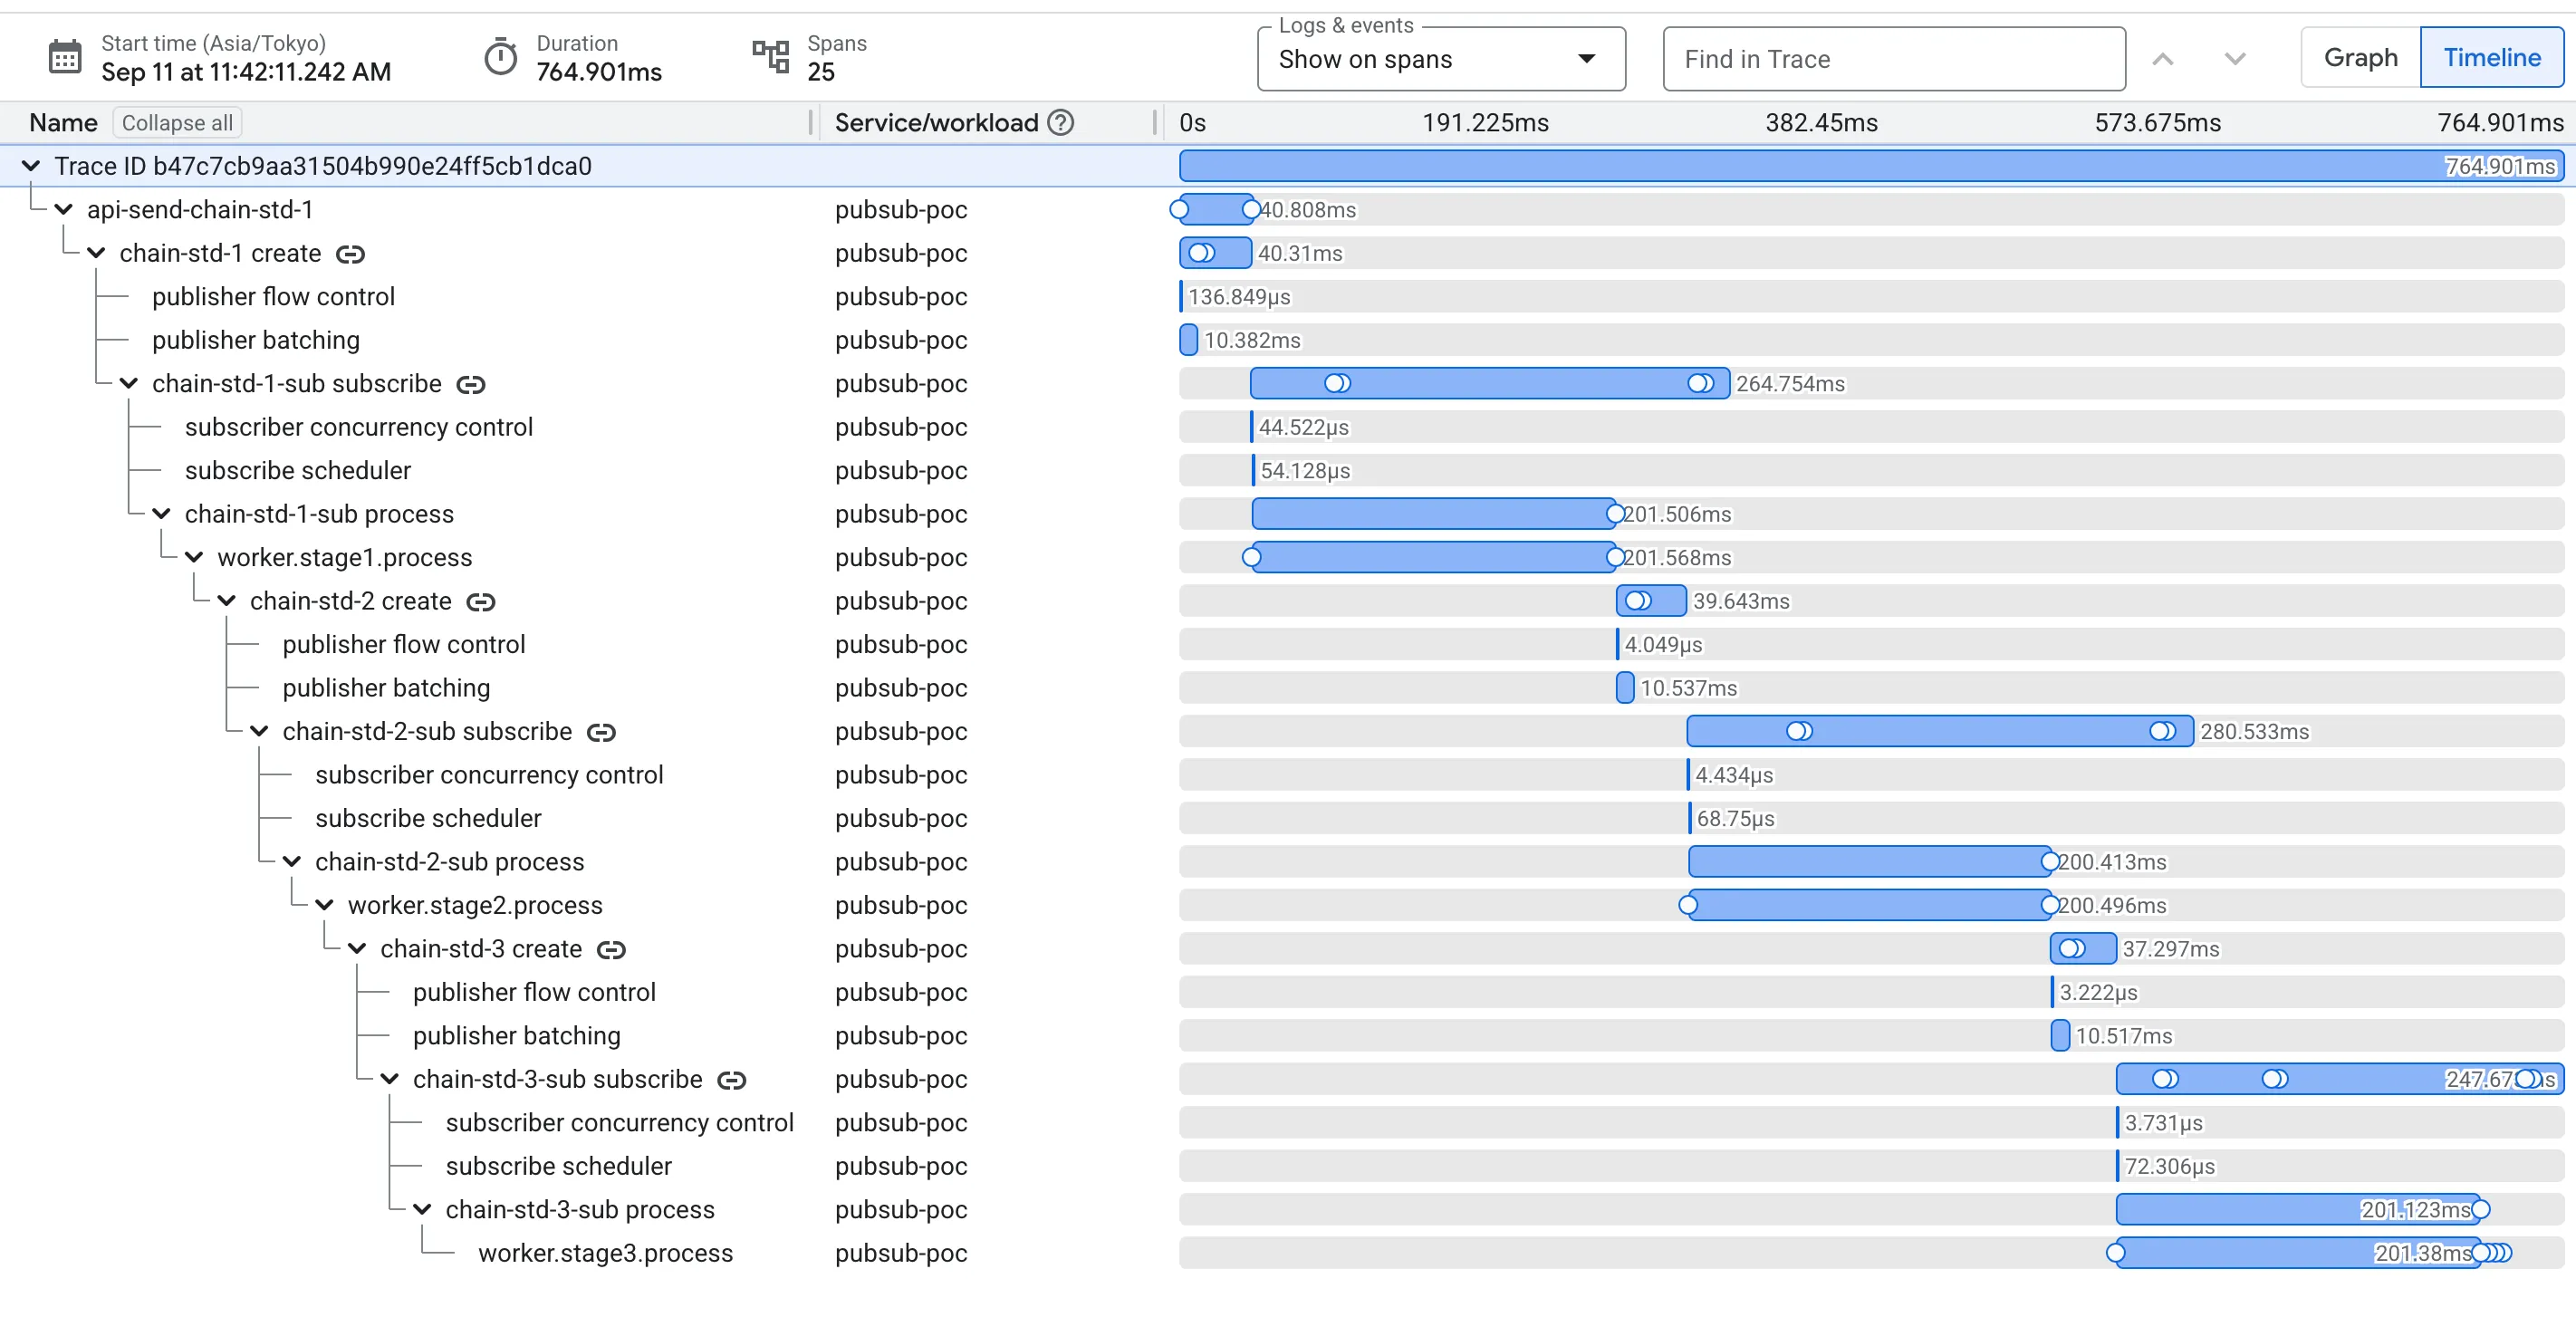
What to look at: in both traces, the simulated worker.stageN.process work is identical, 200ms.
The difference is entirely inside the subscribe span that wraps it and the blank parts.
Modack and Ack
GCP docs barely explain this.
ModifyAckDeadline(modack): extend lease. It’s like acquiring the lock.Acknowledge(ack): done processing, permanently remove this message. No more redelivery.
For EOS, it has to wait for the response of modack while standard subscriptions doesn’t need to.
Where each shows up in the trace, and which function writes it:
- Delivery gap (blank, no span):
publish end->modack start. - Dispatch gap:
modack start->modack end, written by sendModAck() , same ModifyAckDeadline RPC — this is the wait, EOS-only. - Callback:
modack end->ack start, callback function(client side) - Ack:
ack start->ack end, written bysendAck(), wrapping theAcknowledgeRPC.
Cold, all three inflate together except your callback. Warm, they shrink and start overlapping in time.
Test Setup
- 3-hop Go worker chain, 200ms x3 simulated processing.
- STD and EOS chains deployed side by side on GKE, same code, only subscription type differs.
NumGoroutines=4on EOS and STG workers by default.- Measured via OpenTelemetry and Cloud Trace, split per hop into delivery gap / EOS dispatch gap / processing.
Architecture

Data
- Sample size: n=31 for both, for a fair percentile comparison.
- Protocol: constant 1 RPS per chain for 30s, via a k6 Job running in-cluster.
Sending method: grafana/k6 Job in the same namespace, constant-arrival-rate executor, 1 req/s per chain against api-eos/api-std’s internal Service.
/send doesn’t wait for the full chain to finish. It returns right after publishing. Latency below is measured end-to-end from Cloud Trace, not /send’s response time.
End-to-end latency after deducting the 600ms simulation processing time.
| Metric | STD (n=31) | EOS (n=31) |
|---|---|---|
| min | 120ms | 601ms |
| p25 | 132ms | 1955ms |
| p50 | 135ms | 2605ms |
| p75 | 137ms | 2802ms |
| p90 | 226ms | 3606ms |
| p95 | 233ms | 4155ms |
| mean | 146ms | 2618ms |
| max | 236ms | 4707ms |
Same gaps, summed across all 3 hops per trace so this is the total delivery/dispatch overhead contributed to one full chain run:
| Gap sum (3 hops) | STD (n=31) | EOS (n=31) |
|---|---|---|
| delivery | ~0ms | min 301ms / p50 368ms / mean 389ms / max 580ms |
| dispatch | ~0ms | min 66ms / p50 1118ms / mean 1455ms / max 3093ms |
Across a full 3-hop chain, EOS’s modack wait alone (dispatch gap) contributes roughly 1.1s at the median and up to 3s in the tail — on top of ~370ms of delivery gap. STD contributes essentially nothing on either front.
Data at 5 RPS
Same setup, same cluster, rate: 5 instead of rate: 1 in the k6 Job, and -num-goroutines=10 (up from the default 4) on both STD and EOS workers so the concurrency setting is fair across chains.
This is a warmed-up connection, which is closer to what a real sustained-throughput service looks like:
End-to-end latency deducting the 600ms simulated handler time.
| Metric | STD (n=151) | EOS (n=151) |
|---|---|---|
| min | 73ms | 429ms |
| p25 | 174ms | 543ms |
| p50 | 181ms | 639ms |
| p75 | 186ms | 650ms |
| p90 | 188ms | 943ms |
| p95 | 188ms | 1643ms |
| mean | 177ms | 758ms |
| max | 276ms | 2644ms |
Delivery/dispatch gap sum (3 hops) at 5 RPS:
| Metric | STD delivery (n=151) | EOS delivery (n=151) | STD dispatch (n=151) | EOS dispatch (n=151) |
|---|---|---|---|---|
| min | -12ms | 259ms | 0ms | 29ms |
| p25 | -4ms | 356ms | 0ms | 49ms |
| p50 | -3ms | 386ms | 0ms | 64ms |
| p75 | -2ms | 431ms | 1ms | 94ms |
| p90 | -1ms | 472ms | 1ms | 147ms |
| p95 | 0ms | 503ms | 1ms | 1062ms |
| mean | -3ms | 427ms | 1ms | 157ms |
| max | 23ms | 3436ms | 4ms | 3094ms |
I am not sure why the calculation from “Publish End” -> “Subscription Start” in the STD results in negative latencies. You can simply treat these as 0ms.
Next action: will EOS perform better at 100 RPS? 1,000 RPS?